December, 2021 | School Project - Wilfrid Laurier University
Project Type: Group
Role: Analyzed user research, developed prototypes
The UNICEF Survey is a mobile application that allows children and youth to have a voice in their community. By providing them with the ability to answer carefully curated questions while simultaneously playing games, UNICEF can collect valuable data for their yearly Canadian child and youth well-being index report.
Project Brief
The Canadian Index of Child and Youth Well-being measures the rights and well-being of young people in Canada from birth to 17 years old and guides action to address their challenges. The index also provides a snapshot of what life is like for young people in the community. As Covid has made it impossible to host in-person events, we are helping UNICEF to transition to a more Covid-friendly approach. The project's main objective was to develop an engaging and interactive mobile survey to help gain the knowledge needed for the index.
Software Used
Miro
Adobe Illustrator
Adobe XD
Research and Discovery
User Interviews
In the early stages of our research, we conducted 8 semi-structured interviews with parents and elementary teachers. Our goal was to delve into the intricate world of children, aiming to gain insights into their interests, preferences and unique attributes. We also aspired to pinpoint the ideal language and vocabulary proficiency tailored to our target age group (6-17 year olds), solicit creative input on visual design components that might captivate young minds and uncover any privacy or safety concerns that parents may have towards letting their child participate in our survey.
Key Insights
When designing surveys for children, it’s crucial to consider several key factors. Firstly, children tend to have shorter attention spans, making it essential to keep our survey concise, engaging and age-appropriate to ensure their interest throughout the process. Secondly, incentives can be a powerful motivator in encouraging children to participate. By incorporating a rewards system, we may be able to increase our number of participants. We also recognize that the reading abilities of our participants will differ. Because of this, we will need to ensure that our questions/instructions are easy to understand. And lastly, we acknowledge that children will likely have little to no interest in filling out a typical survey form. It will be essential to incorporate interactive, visually appealing, and enjoyable elements into the survey design to make the experience more captivating and enjoyable.
Due to the age group of our target audience, parents will also play a pivotal role in our design choices for this survey. When talking with parents, we discovered that their children's privacy is very important to them. Parents deeply value safeguarding their children’s personal information. When designing this survey, transparency will be important as parents desire a clear understanding of why their children’s data is being collected. Most parents will also want to be actively involved in the survey process to ensure that their children’s participation is secure, beneficial and aligns with their values. Due to this, it will be essential to include robust privacy measures, communicate the purpose of data collection clearly, and offer opportunities for parental involvement to establish trust and reassurance.
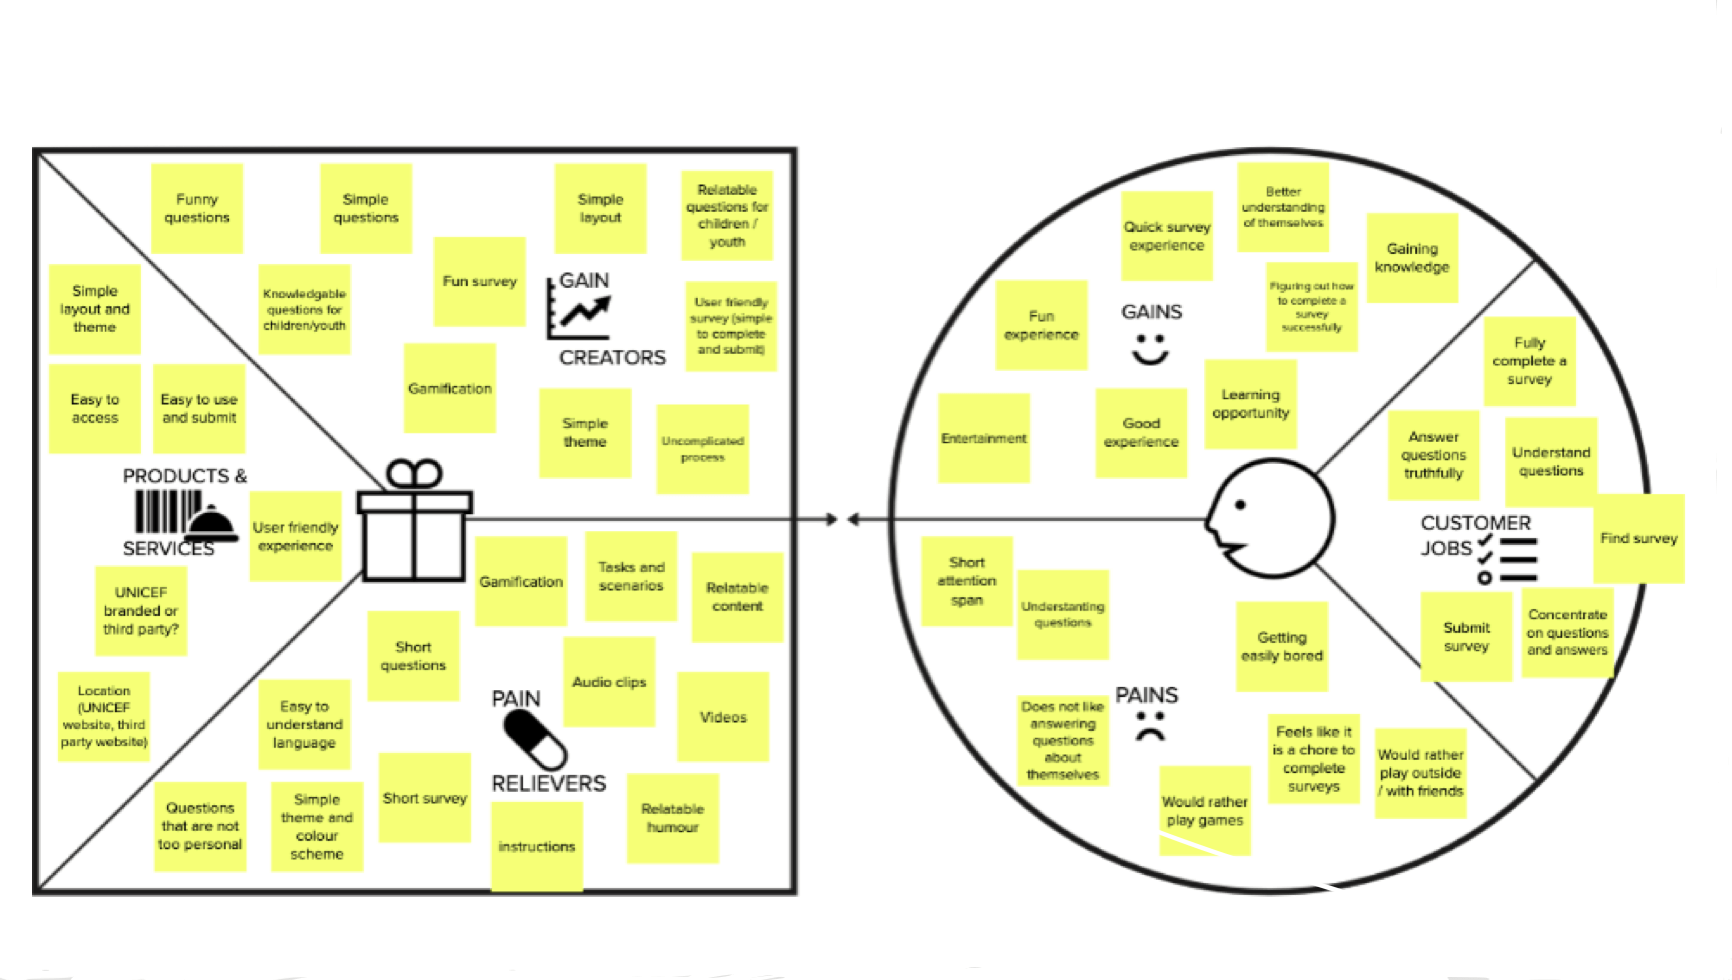
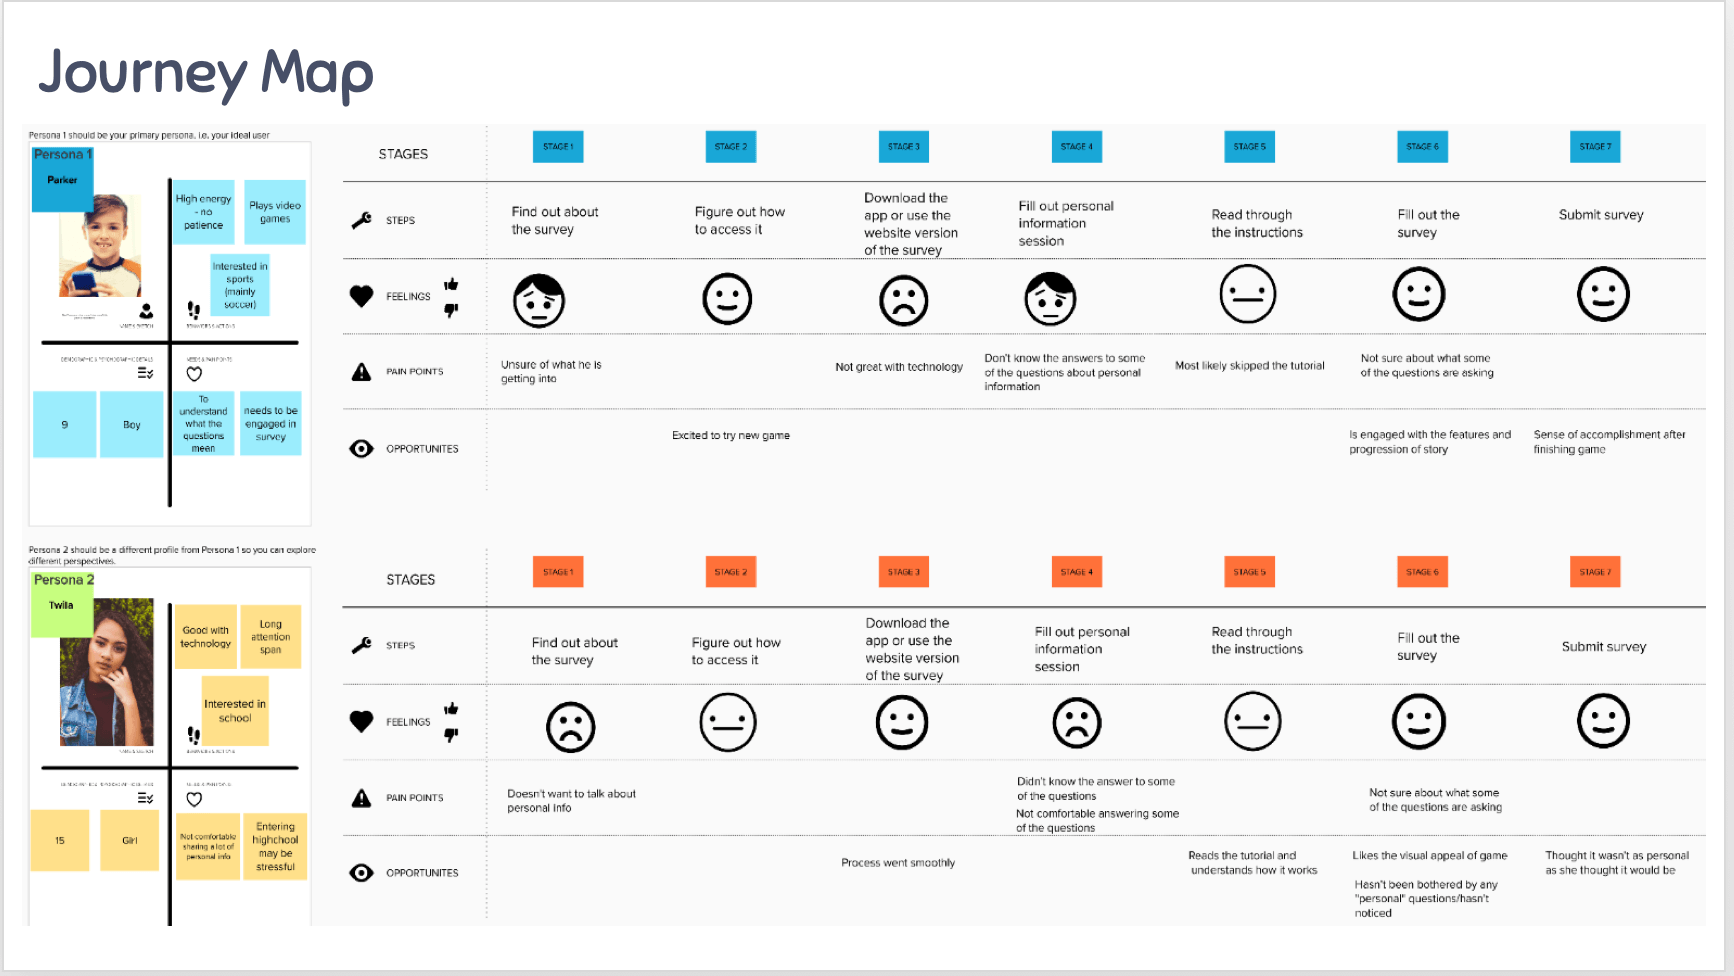
With the information collected during our user interviews we developed 2 personas (teenager and child) with correlated journey maps and a value proposition canvas.
Fig.1 Value proposition canvas
Fig.2 Personas & journey maps
Design Process
Ideation
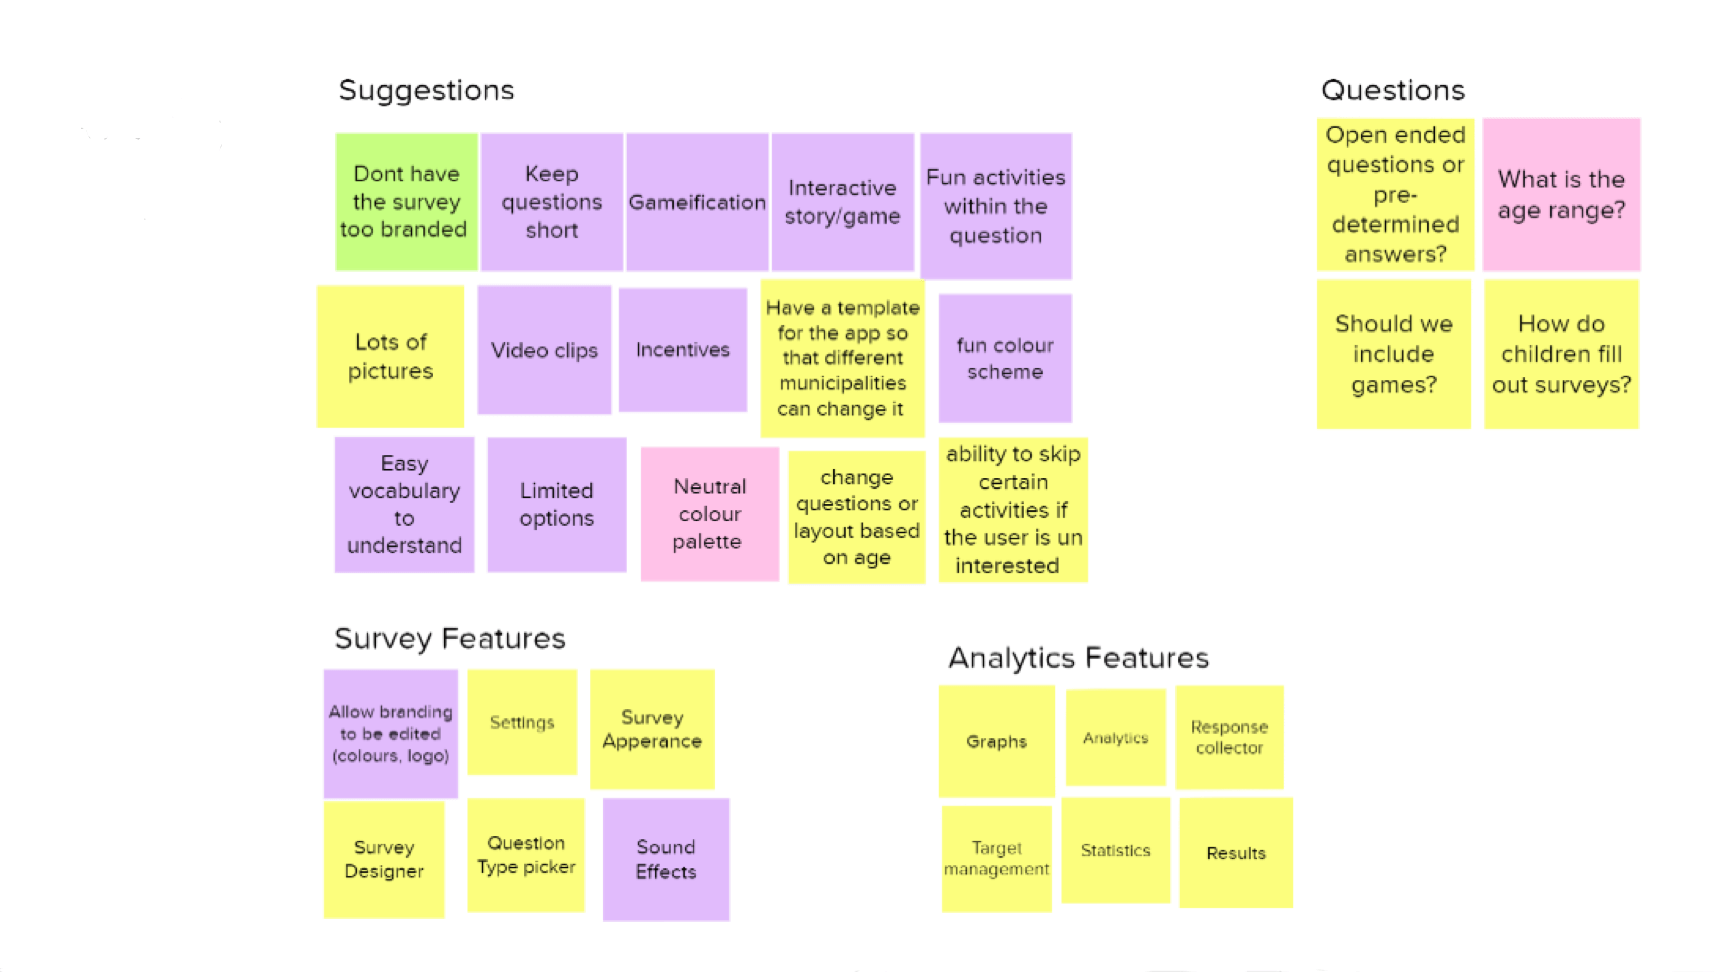
As we began our initial ideation phase, we developed an affinity diagram on Miro to help us brainstorm possible features and ideas for this application. We meticulously grouped and colour-coded related concepts.
Fig.3 Affinity map
Design Goals
Game format
By presenting our survey as a game, we believe that children will be more intrigued to try it
Motivation through incentives
By incorporating a rewards system or incentives to motivate children to participate in the survey, we can improve the participation rates
Engagement and attention
Designing our survey in a concise, engaging and age-appropriate manner will help us to better hold the children’s attention throughout the process
Clarity in communication and navigation
Questions and instructions should be clear and easily understandable by our target age group (6-17 year olds)
Children should be able to easily navigate throughout our survey
Accessible
As this solution will be provided digitally to our user group we need to ensure that we are following accessibility standards
Inclusion of interactive elements
By integrating interactivity, visually appealing and enjoyable elements into our survey we will be able to enhance the overall experience and captivation of our users
Privacy, security and transparency
We need to maintain transparency in data collection and processes to address parents’ concerns about their children’s privacy. This may include explanations of why the data is being collected and its intended use
Inclusion of privacy measures to protect children’s personal information and maintain trust with parents
Parental involvement
Provide opportunities for parents to participate in the survey process
Sketches
As we began drawing our initial sketches for our survey, we started exploring some popular games amongst our targeted age group (6-17 year olds). Through this, we determined that some popular games at the time were The Sims, Minecraft, Animal Crossing and Toca Life World. While researching these games, we noted some key commonalities including:
Sandbox gameplay: Players are able to explore, create and interact with the in-game world at their own pace
User created content: Players can customize their environment or characters
Open-ended play: The game doesn’t have a fixed narrative or end goal, players are simply able to pursue their interests
Family-friendly: These games feature content that is appropriate for a broad audience
Longevity: Regular additions and updates to these games provide a long-lasting appeal
Relaxation and creativity: These games provide users with stress-free environments and the ability to express themselves through their creativity
Achievements: Users are provided achievements for accomplishing tasks
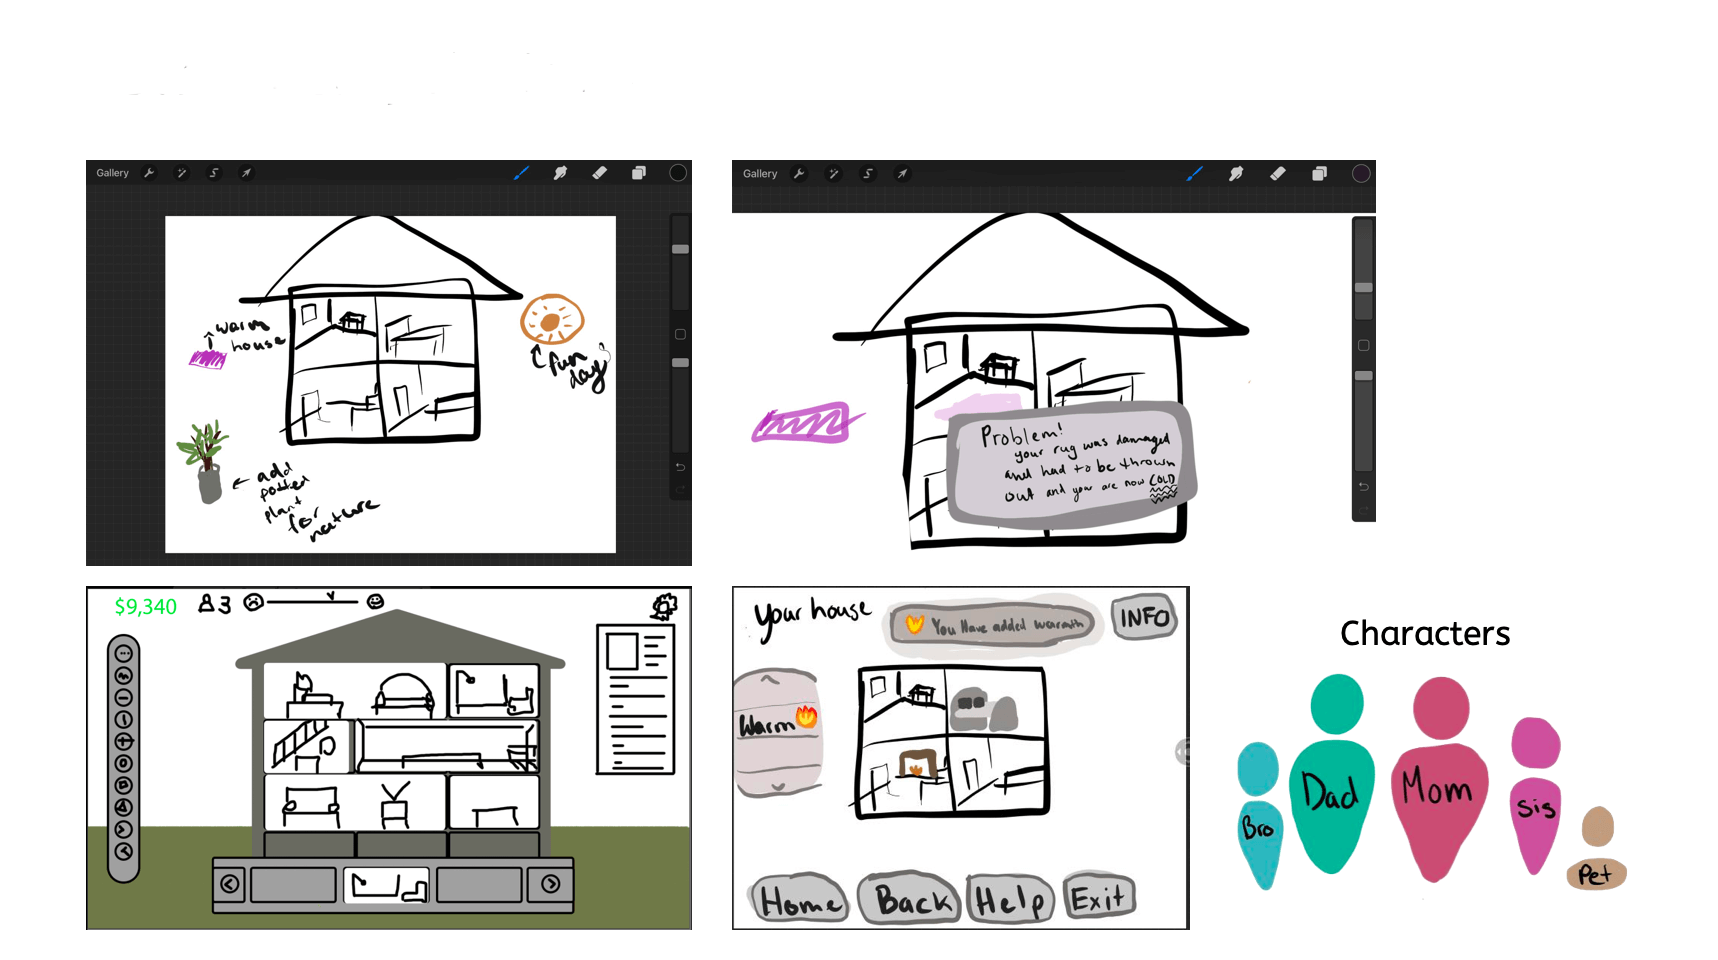
Fig.4 Prototype sketches
Prototyping & User Testing
Testing Methods
For this project, 2 phases of user tests were conducted with our secondary target group (parents). I was responsible for developing the final prototype. These tests were conducted remotely using Zoom. In our first round of usability testing, one of our team members would share their screen with the participant and encourage them to direct the team member to a specific menu option or page to complete the tasks. In our second round of testing, we had participants share their screens and interact with the prototype themselves.
The Think Aloud Protocol was our primary method of gathering information from our participants, as it was important for us to hear their thought processes when navigating our solution. A designated note-taker recorded observations, and each session was recorded and further analyzed to uncover further insights about our design. By converting the raw data into meaningful information, we could establish user mental models and modify the prototype appropriately.
Goals for Usability Test
Usability: users experience 2 or fewer errors while completing tasks
Learnability: do the users understand how to navigate the system
Task completion: can users complete the tasks
Usability Tasks
We composed a series of tasks for users to complete for our usability test. These tasks focused on some of the main functions of our mobile survey. Some of these tasks included customization of the user’s home, answering a survey question and locating information regarding the survey.
The success of each task was broken down into 3 evaluation categories: pass, indirect, and fail. Through this evaluation, we determined the viability of our current design. Upon completing our tasks, participants would be asked follow-up questions based on their comments during the test to help gain further insight. Each identified usability issue was then evaluated based on its severity (the level of distribution to the completion of the task) and the frequency of the error (the total number of times the error occurred during this phase).
Participants
For this project, our participants were primarily parents. 4 Participants were used for each phase of testing.
Low-fi Prototype
Our initial usability test was conducted with the sketches of our prototype (Fig 4). By doing this, we can more easily modify and refine our design before we commit to a particular design direction. As this prototype was not interactive, a wizard test was employed to help simulate the functionality of our survey application. Participants verbalized where they would click on the sketch to work through one of the presented tasks. A group member would then simulate the prototype's response to each action.
Mid-fi Prototype
During the second phase of testing on our mid-fi prototype, we introduced an additional task focusing on the login process of our survey application. Participants were once again evaluated based on their task success and think-aloud protocol. The wizard test was not used during this test because interactive elements were included in the prototype. The high-level goals also stayed the same during this test. All the previously used participants returned for this phase of testing. Our mid-fi prototype was developed on Adobe XD.
Fig.5 Mid-fi prototype
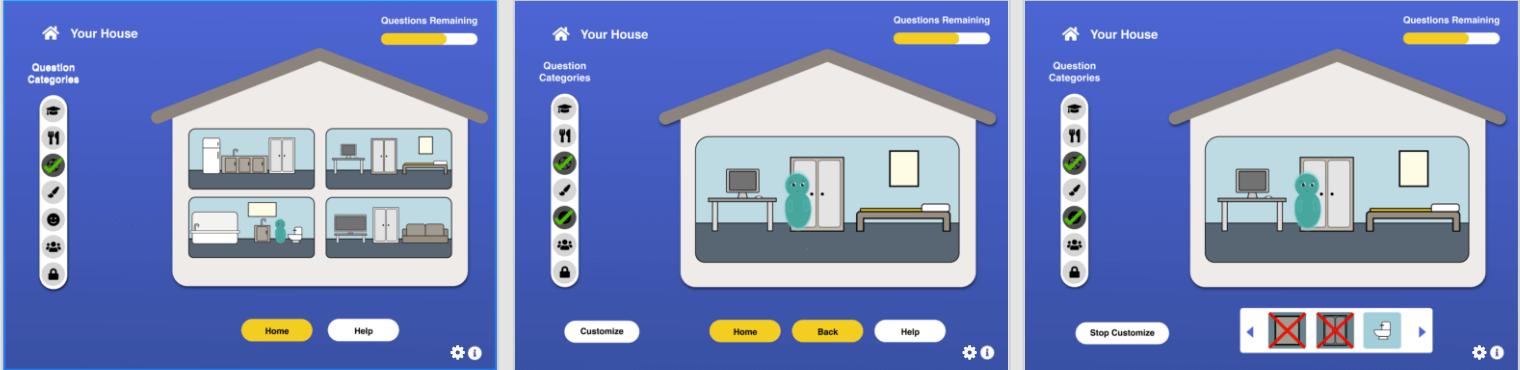
Key Findings and Refinements
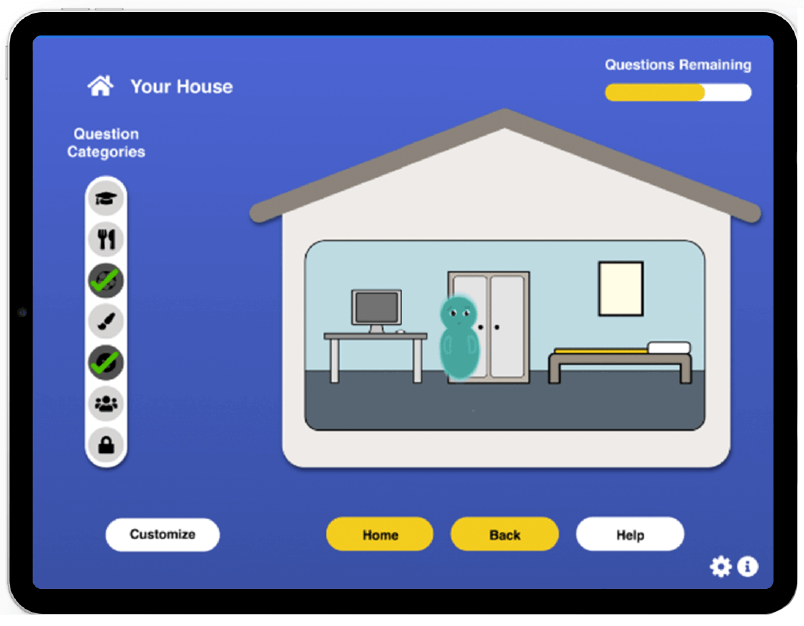
Upon analyzing the insights gathered from all the usability tests, primarily our final test, we were able to form a clear picture of the areas of improvement needed for our design. One of the main issues we discovered was with our category’s menu. Many users stated that they felt “overwhelmed” when looking at the volume of options being presented to them at once (Fig.5). To resolve this, we limited our categories to display 6 at a time to reduce the information overload in our previous design (Fig.7). Many users also stated that they would like an indication as to how many questions still needed to be answered. To help with this, we introduced a progress bar at the top of the screen (Fig.7) and an indication of when a category was completed. Many of our participants liked the ability to customize their own homes but suggested that there needed to be more customization options available. Most users could navigate the application and felt the survey would not compromise their children’s privacy.
Final Prototype
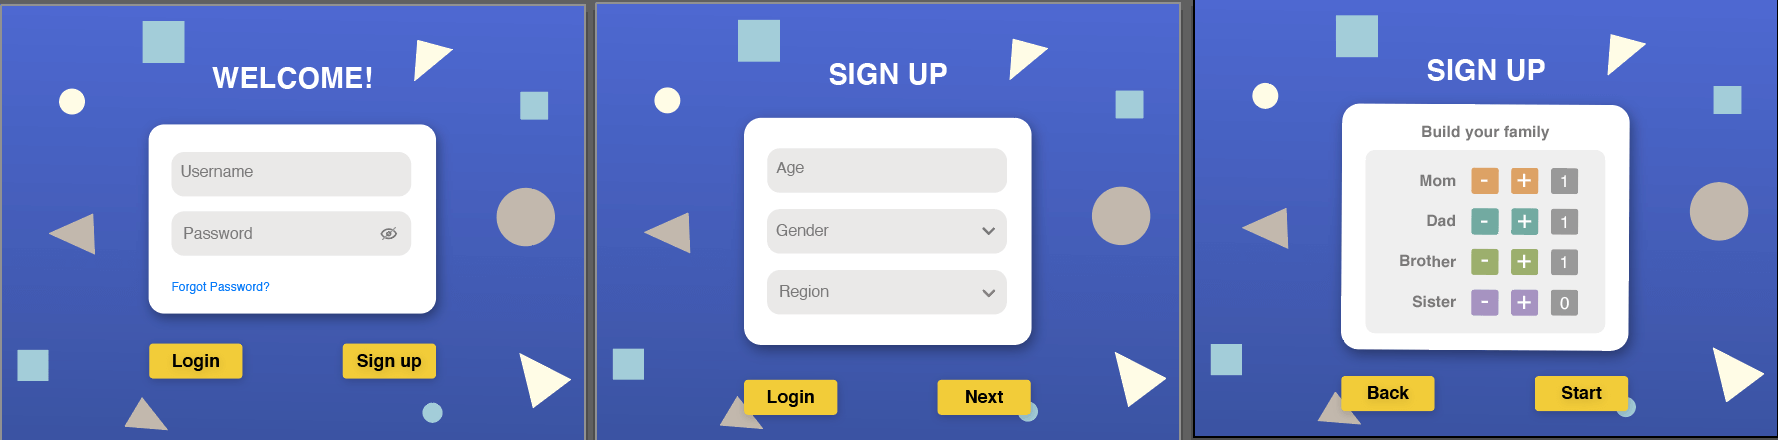
Initially users will have the option to log in or sign up. If the user presses sign up, they will be required to answer a few questions about their age, gender, and the region they live in. Next, the user, will be asked to add their family members. This will help us to create their family within the game.
Fig.6 Login Process for application
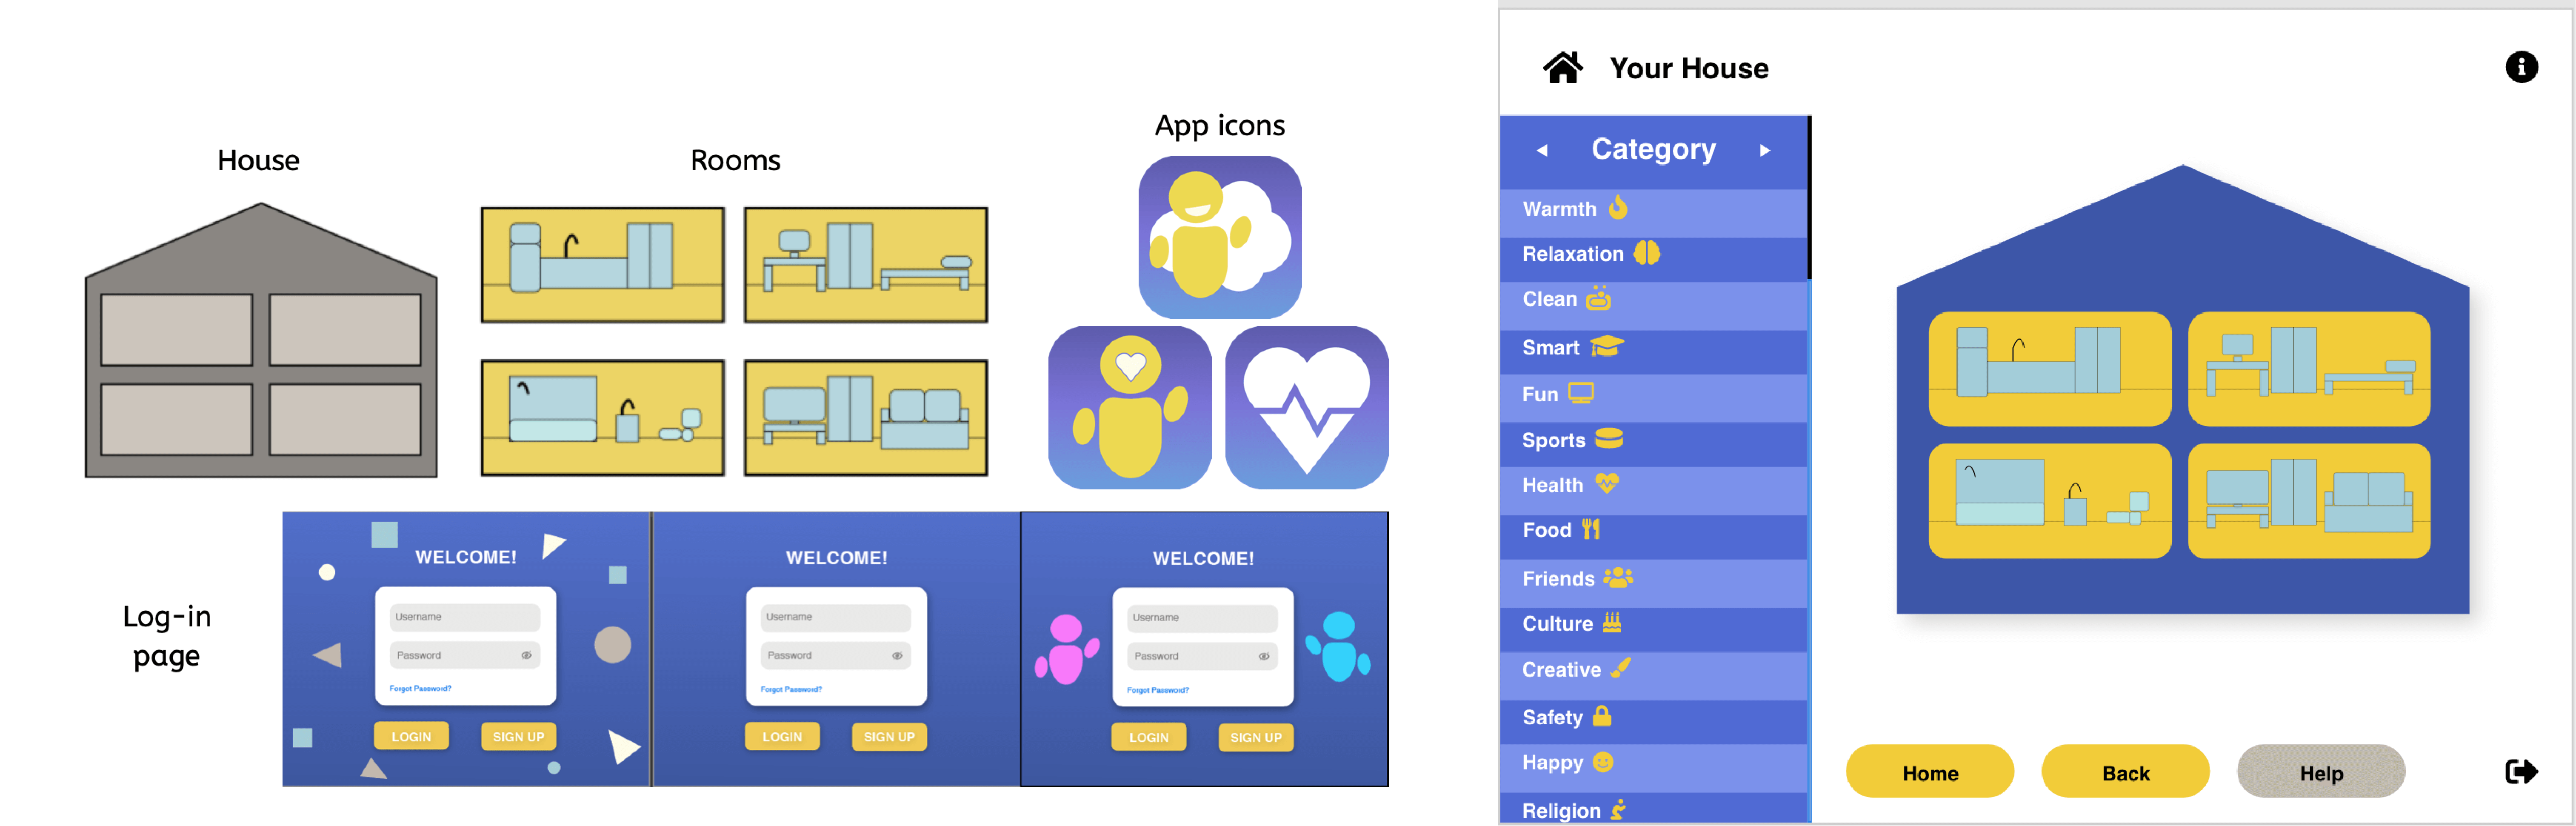
After the initial set-up the user can begin customizing their rooms. Users can change room colours and add new furniture. If the user clicks on one of the 4 rooms, it will show them a single room view. The question menu is on the left-hand of the screen. Users can select a category icon and be presented with a related question. In order to unlock more customization options, users are required to answer questions.
The user will be presented with random questions that will affect the house based on the users' responses. After the user answers a question in the app, the data is then relayed back to UNICEF to help them develop their yearly index.
Fig.7 Customization features of home
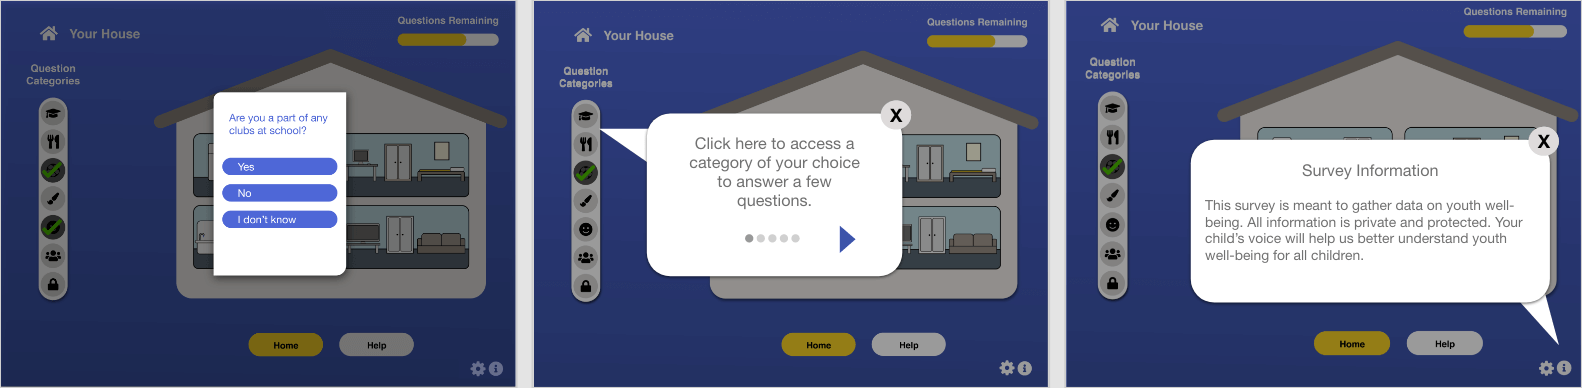
The application includes an initial tutorial that can be accessed whenever desired. This tutorial includes information on UNICEF, the purpose of this survey and how the data is used.
Fig.8 Tutorial walk through
Future Iterations
For the next steps of this project, we would like to expand the game into community building and school life, where children can answer questions and interact with an entire community rather than a single house. We would also love to explore real-life incentives as we believe it would encourage more users to the application.
Reflection
One of the main challenges faced during this project was the inability to directly connect with our target user group (navigation year olds). This challenge posed a few issues we needed to be continuously aware of when designing our solution. Some of these issues included limited validation of our solution's success and assumptions being made by parents about their children. By developing personas and conducting additional secondary research, we limited the number of assumptions gathered during our user interviews.
As my previous projects had only included in-person interactions with participants, this project presented me with a first-hand look at a remote environment. Through this project, I learned the importance of adaptability, self-discipline, effective communication skills, and the need for regular feedback and collaboration among team members.
Conclusion
With the UNICEF Survey, we can seamlessly integrate gameplay elements into the data collection process, ensuring that our users provide valuable insights for UNICEF while also enjoying the experience. By making this survey engaging and fun, we believe our solution will result in a higher participation rate. This approach transforms data collection into an adventure and amplifies the impact of UNICEF’s mission by harnessing the power of ‘play’ to drive social change.